Supplementary
本文最后更新于:2023年11月30日 晚上
Supplementary of 'Online monitoring dynamic characteristics in thin-walled structures milling: A physics-constrained Bayesian updating approach'
A. The practicability on complicated thin-walled structures
The vibration model used in the paper are only applicable to the Kirchhoff-Love plate with fixed-free boundary conditions. Nonetheless, the physical constraints can be revised to adapt to more complicated structures such as doubly-curved (e.g. turbine blades) or pocket structures (e.g. airframe parts). A general equation of the mode shape functions can be expressed as: \[ \begin{equation} W(x, y)=\sum_{m=1}^{p} \sum_{n=1}^{q} A_{m n} X_{m}(x) Y_{n}(y) \end{equation} \] where \[ \begin{equation} \begin{array}{l} X_{n}=C_{1,x}\sin \alpha x + {C_{2,x}}\cos \alpha x + {C_{3,x}}\sinh \beta x + {C_{4,x}}\cosh \beta x\\ {Y_m}=C_{1,y}\sin \alpha x + {C_{2,y}}\cos \alpha x + {C_{3,y}}\sinh \beta x + {C_{4,y}}\cosh \beta x \end{array} \end{equation} \] The simplified boundary conditions used in the paper are based on the Euler-Bernoulli beam, which is no longer applicable for these structures. A more precise form of boundary conditions of thin-walled plates are listed as follows:
For fixed boundary at x=0, \[ \begin{equation} { {\left. W \right|}_{x = 0} = 0,\quad {\left. {\frac{ {\partial W} }{ {\partial x} } } \right|}_{x = 0} } = 0 \end{equation} \] For simply supported boundary at x=0, \[ \begin{equation} { {\left. W \right|}_{x = 0} = 0,\quad {\left. {\frac{ { {\partial ^2}W} }{ {\partial {x^2} } } } \right|}_{x = 0}} = 0 \end{equation} \] For free boundary at x=a,
$$ { { {\left. {\frac{ { {\partial ^2}W} } { {\partial {x^2} } } + \mu \frac{{{\partial ^2}W} } { {\partial {y^2}}}} \right|}_{x = a}} = 0,\quad { {\left. {\frac{ { {\partial ^3}W}}{{\partial {x^3} } } + (2 - \mu )\frac{ { {\partial ^3}W} } { {\partial x\partial {y^2} } } } \right|}_{x = a} } = 0} $$ Besides, for the angular corner with two adjacent free boundaries, the shear stress equals zero, $$ {\left. {\frac{ { {\partial ^2}W}}{{\partial x\partial y}} } \right|_{\begin{array}{*{20}{c}} {x = a}\\ {y = b} \end{array}}} = 0 $$The above mode shape functions and boundary conditions can be adequate for various thin-walled structures like doubly-curved or pocket structures. Nevertheless, further researches is needed if the thickness and geometry irregularity of the structure is non-negligible.
B. The acquisition of experimental FRF
In the experimental work, the computation of experimental FRF uses Welch’s method and H1 estimator from the measured machining forces and accelerometer response. The resolution of the resulting FRF is equal to the spindle rotation frequency (i.e. 20 Hz in the experiment), the bandwidth of which is quite limited. Usually, spindle speed sweep or randomized workpiece pattern is used to enrich the excitation range and resolution. However, constant spindle speed and tool path can make the method more practical in practical machining. Furthermore, despite the relative low resolution in single measurement, the practical resolution can be improved by the proposed online monitoring method by continuous multiple measurement and updating. Because there are more than 10 thousand updating steps during machining process, and the practical resolution and accuracy can be improved step by step. Thus, the monitoring accuracy of the frequency is sufficient in common applications.
Another problem is that the natural frequency of the plates is much higher than the spindle rotation frequency. It is true that the 50th harmonic of the spindle rotation frequency is far from the plates’ first mode. However, the experimental results show that the concerning modes of the plates can be well excited as shown in the following figure.
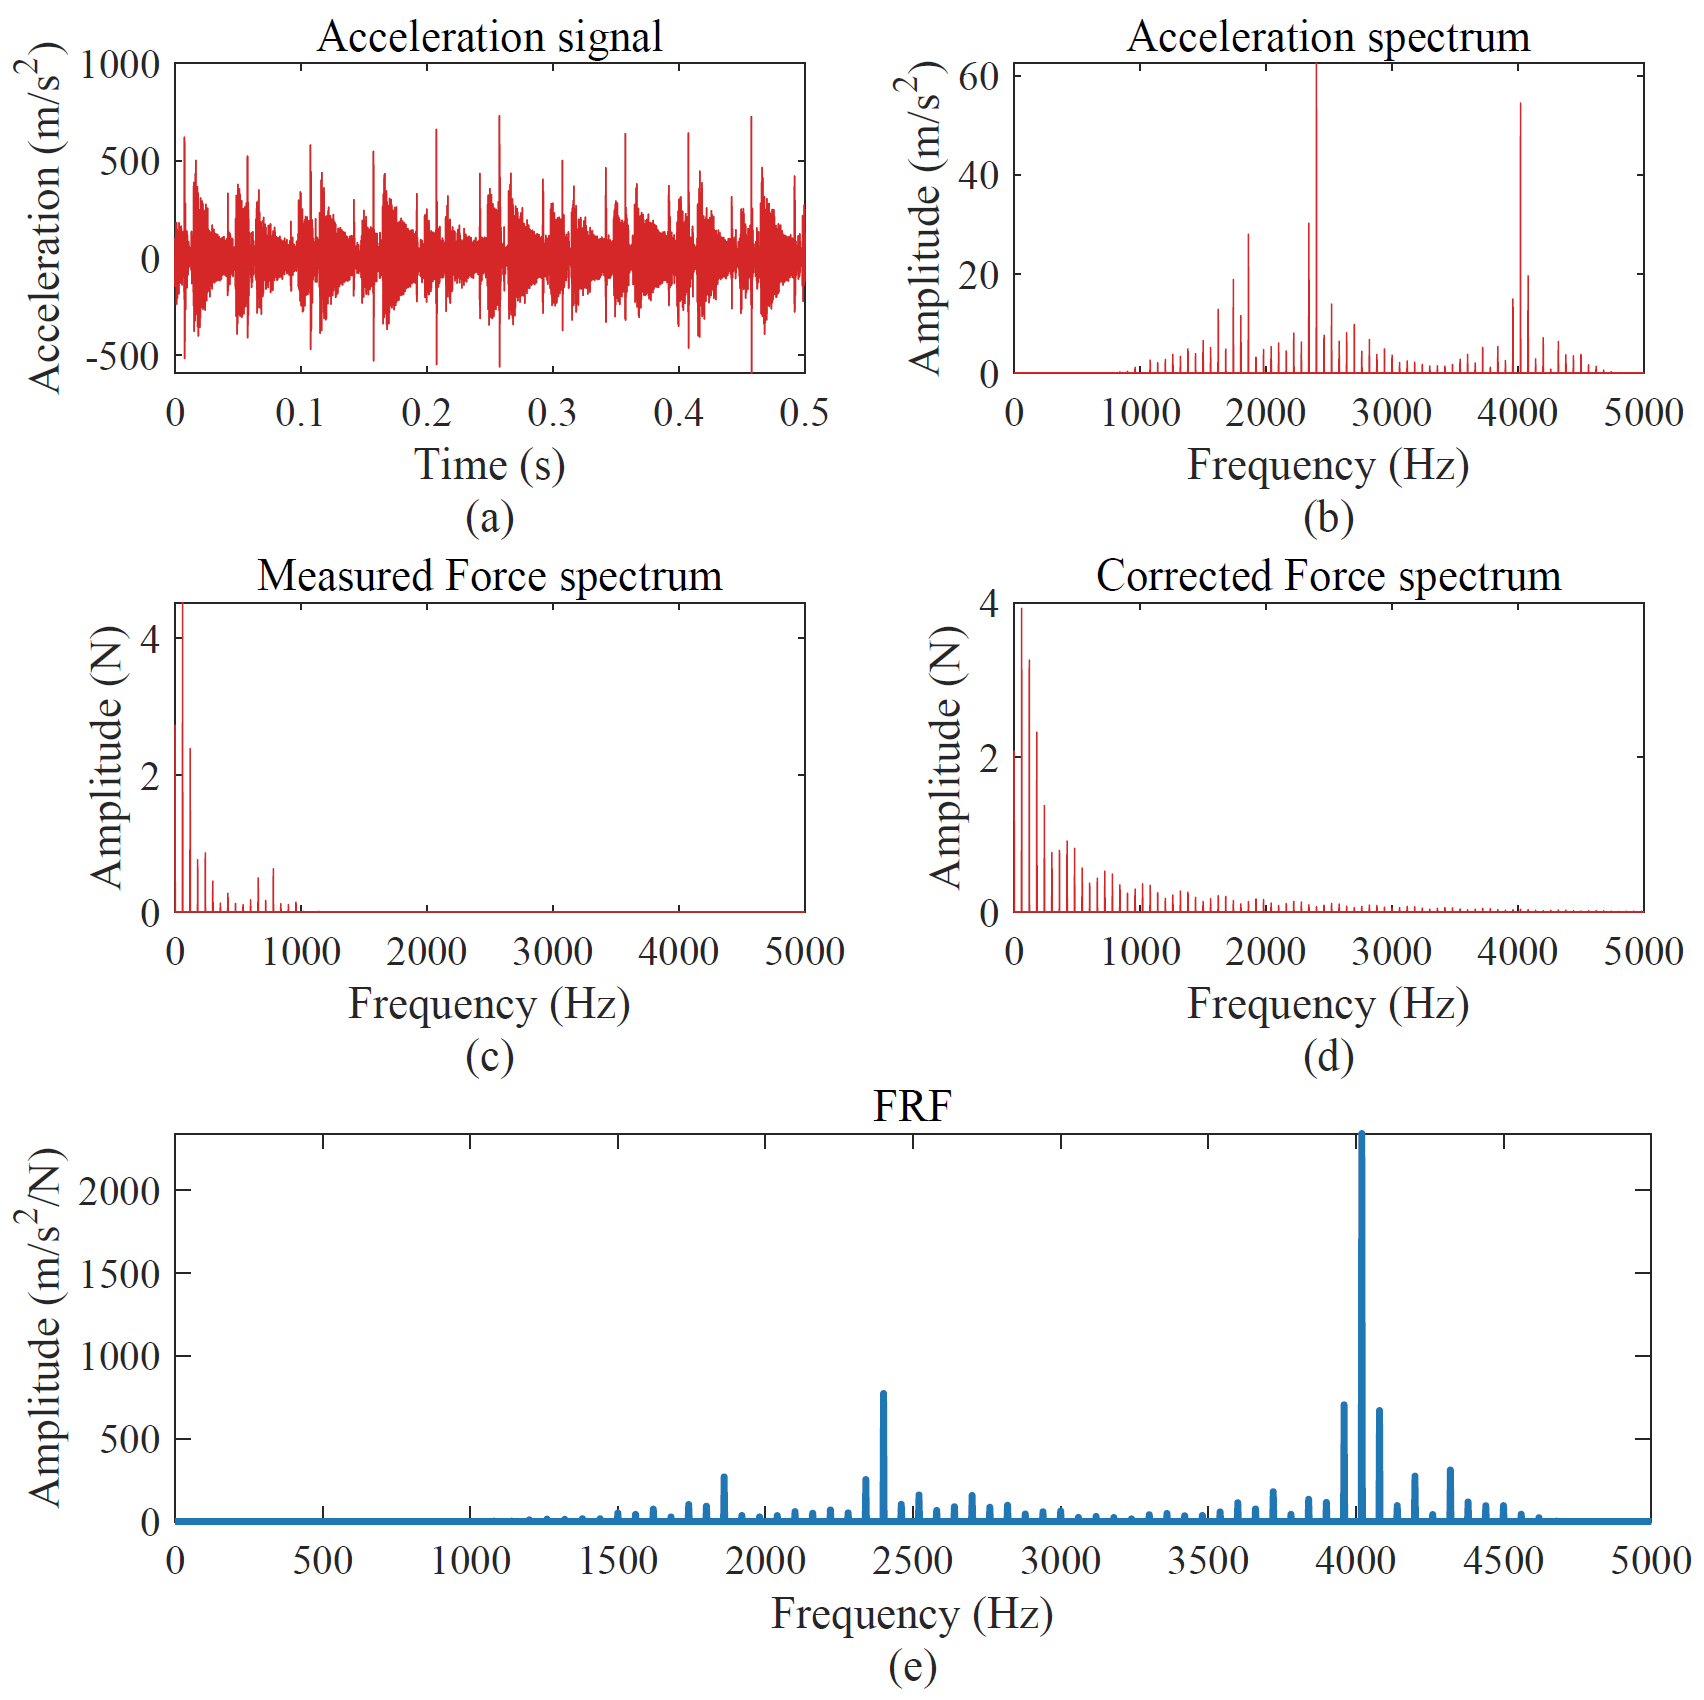
A randomly selected sample of- the monitored signals and the preprocessing are presented in- Fig. 3. The spindle speed and the feed rate are pre-defined and kept unchanged in each tool path during the machining. Therefore, the real-time tool contact location can be obtained by integrating the feed speed as long as the moment of tool entrance is detected in each pass. The differential signal of the acceleration is utilized to detect these moments. The measured force spectrum and corrected force spectrum are presented as in Fig. 1. It shows a cut-off of 1 kHz in the measured force spectrum because of the limits of dynamometer. The corrected cutting force is utilized for a more accurate calculation in high frequency in the monitoring process as the cut-off frequency of the dynamometer is only 1 kHz. Thus, the FRF between the tool contact location and the response point (location of accelerometer) can be calculated with the cutting force and the acceleration signal. From the FRF, observation values of modal parameters including natural frequencies and modal shapes can be derived. The FRF is sampled at the harmonic frequencies of the spindle to avoid unexpected noise.
As shown in the Fig. 1, the spectrum of the (corrected) forces becomes almost zero after 2000Hz. There is a risk that the coherence between the cutting force and the acceleration response becomes poor in high frequency when the workpiece may not be fully excited due to the low magnitude of the force spectrum. Here give two different samples of the magnitude-squared coherence estimated at the harmonic frequencies of spindle speed via welch.
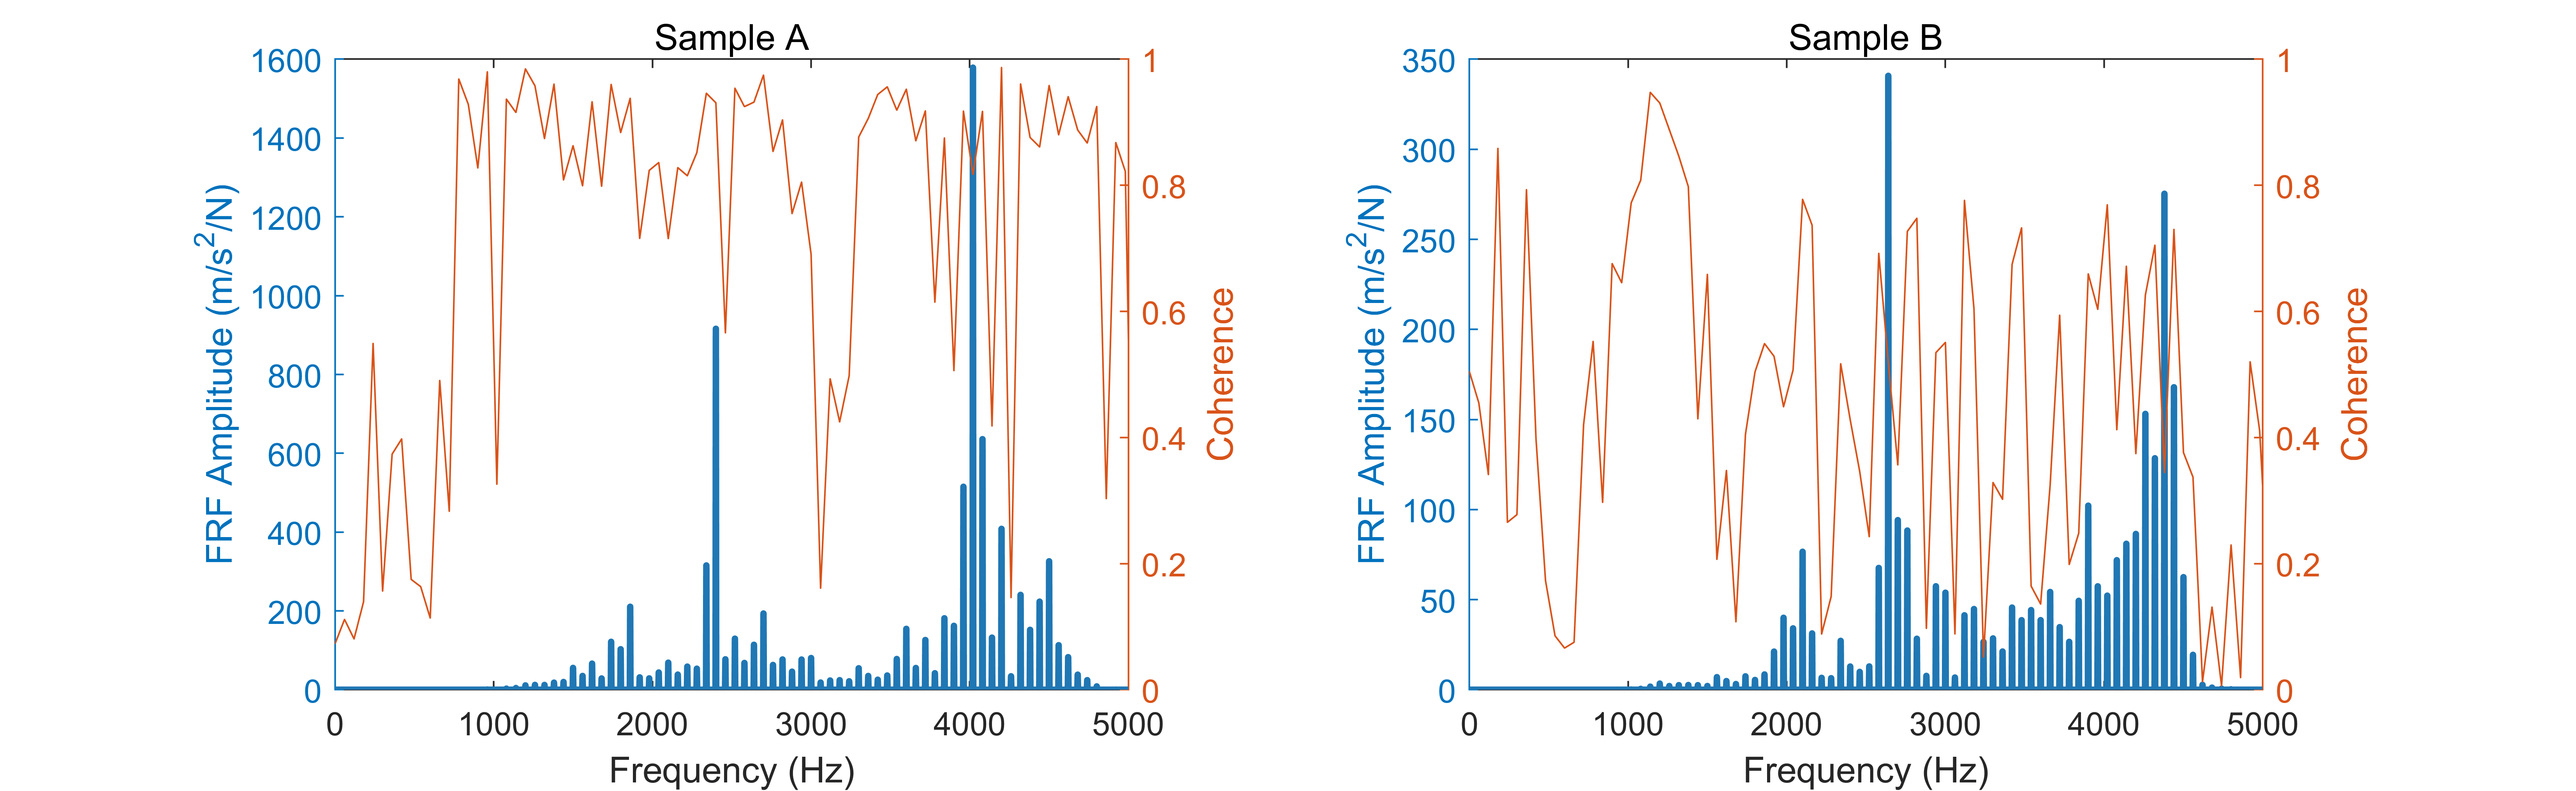
As shown in the above figure, the mean coherence from 2000 Hz to 4500 Hz is 0.79 for sample A, while the mean coherence from 2000 Hz to 4500 Hz is as low as 0.46 for sample B. The coherence of the FRF depends on the noise level of the input signals. The actual processing conditions at different cutting positions and cutting parameters would have various degrees of influence on the noise level of the measured signals.
For sample A, the coherence is acceptable and the measured FRF can provide useful information for the modal parameter update. A highly variant FRF estimation will undoubtedly affect the accuracy of the predictions of the mode shapes. For sample B, the estimated FRF is shown to be distorted by the noise and the true mode information cannot be extracted.
In practice, we reject the information from FRF when the mean coherence is lower than 0.5 by setting the relative coefficients in \(h\left( {\bf{x}}_t \right)\) to zero when executing the measurement update
The installation locations may affect the signal-to-noise ratio (SNR) of the acceleration signals and FRF for different modes of the thin-walled structures. For comparison, two accelerometers are installed on the plate as shown in Fig. 2.
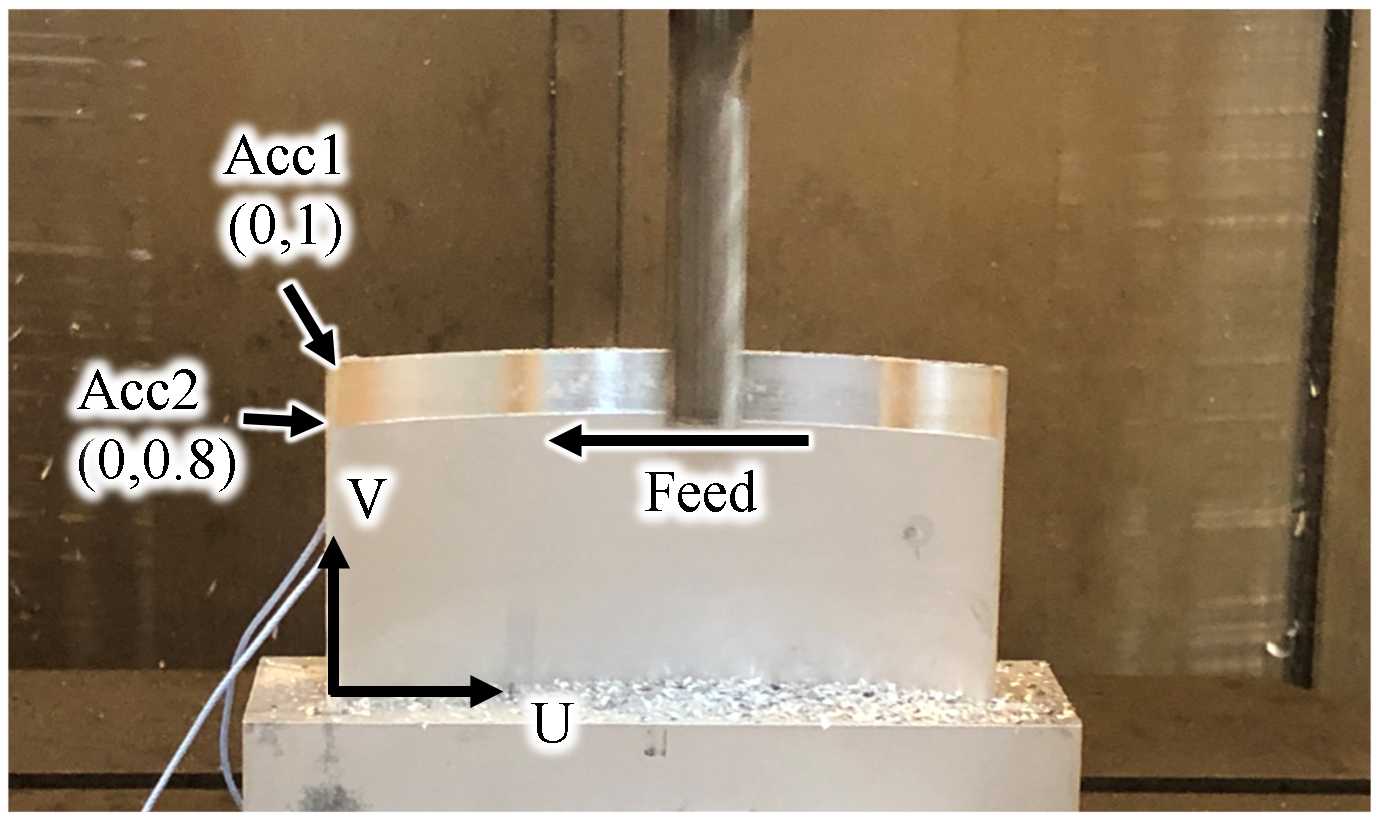
The Acc1 is the accelerometer used in the experiments. The Acc2 works as a reference accelerometer located at (0,0.8) in normalized coordinate. The acceleration spectrums of two accelerometers are presented as follows.
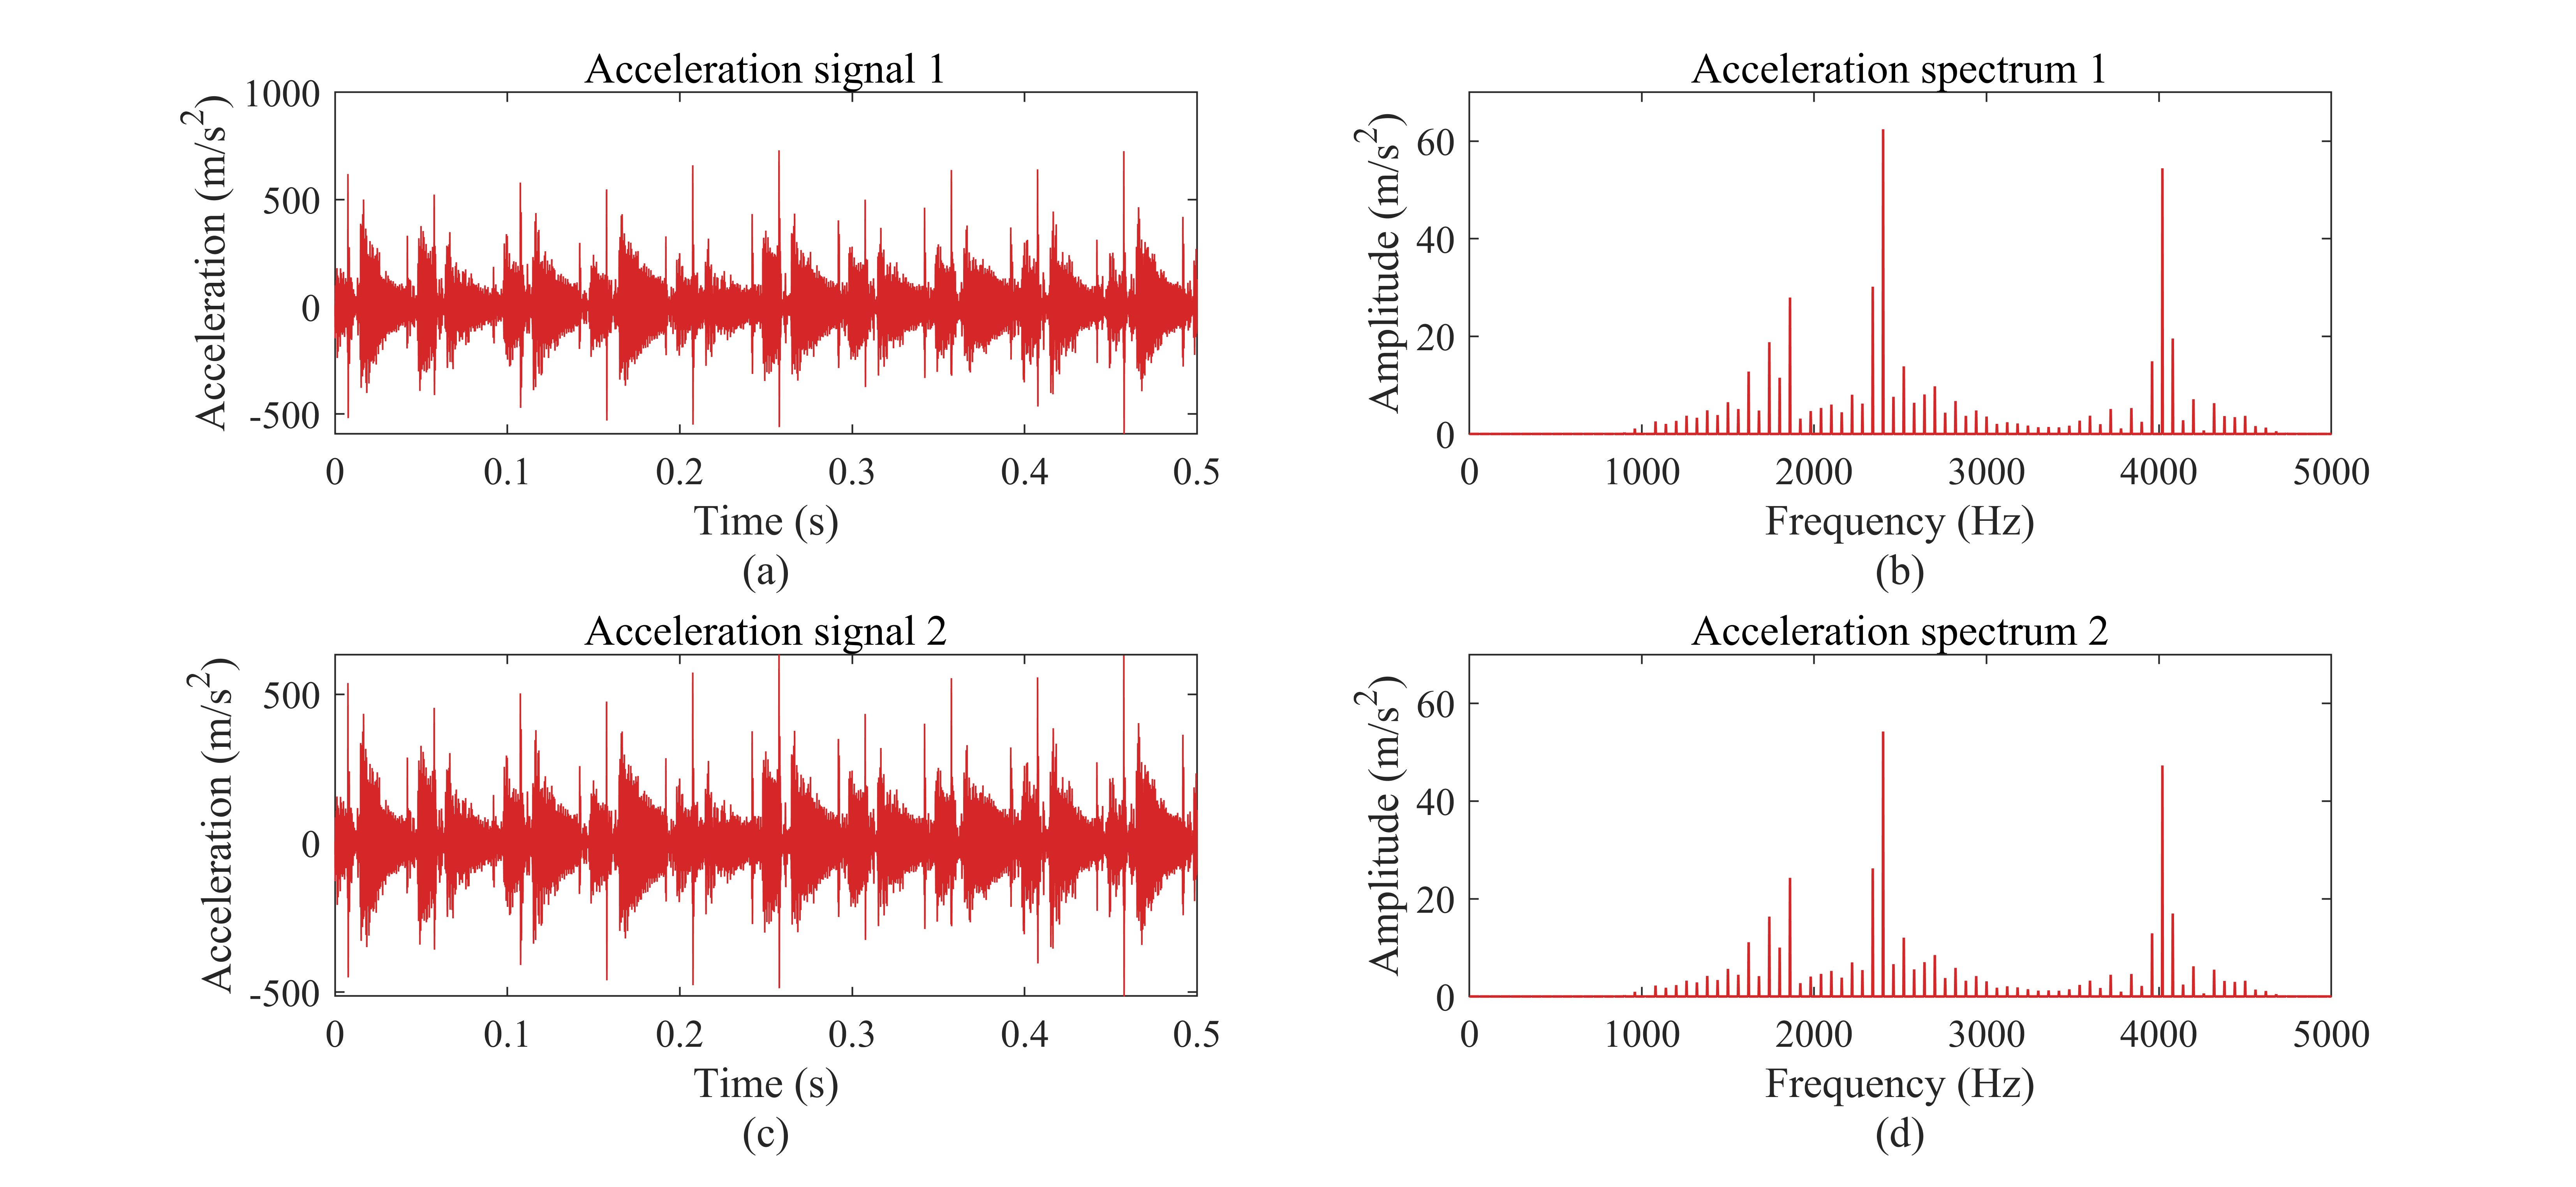
As shown in the figure, the spectrums of two accelerometers have different peak amplitude for each mode. Assuming the signal noises keep the same, the greater the amplitude, the higher the SNR is. For the samples presented in Fig. 6, the SNR of the acceleration signal for Acc2 installed at (0, 0.8) is lower than the other one, which can lead to a relatively lower accuracy for the modal parameters monitoring of the proposed method.
Furthermore, the installation location of the accelerometer should avoid the nodes of modal shapes of all concerned modes because at these locations the response is always zero for the corresponding mode. So the finite element analysis and pre-experiment need to be conducted to provide proper location for the sensor installation.
C. More experimental data
The experiments show the machining processes of two kinds of thin-walled structures from the 4 mm to 3 mm thickness. Due to the page limit, part of the results of the experiments are not presented in the paper. The following figure shows the result of predicted mode shapes of W2 with the proposed physics-constrained method.
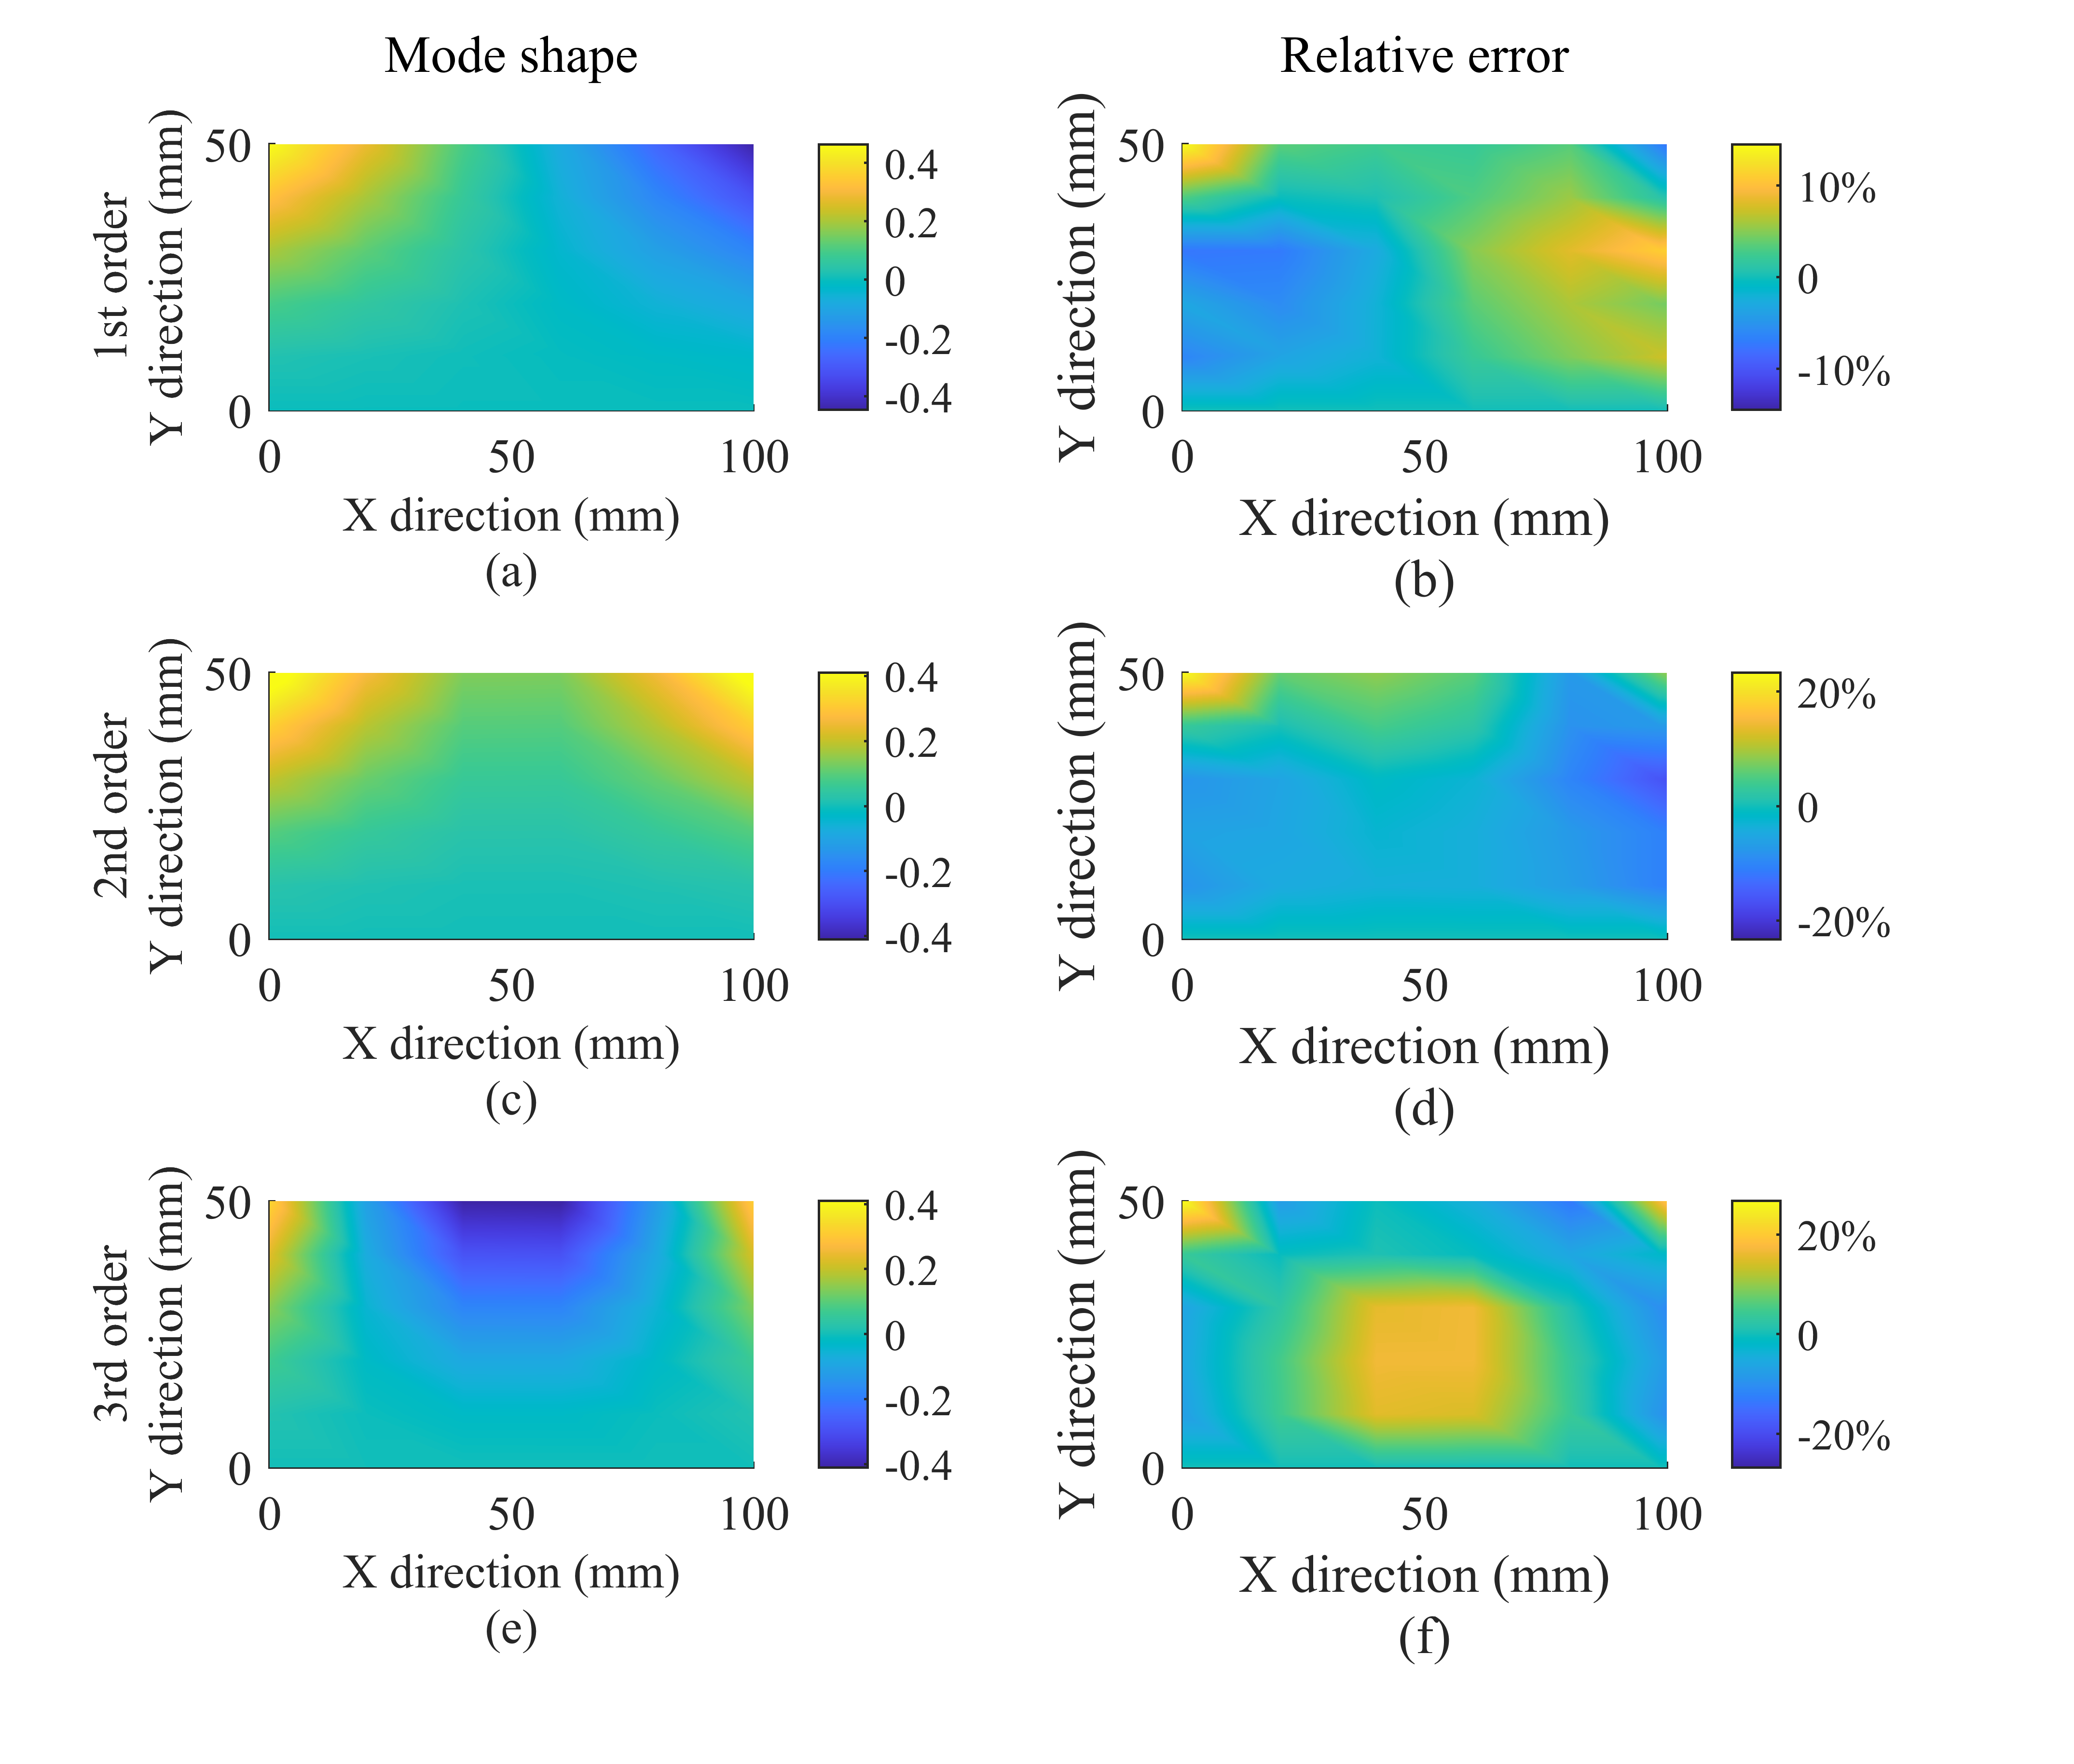
Besides, part of the results of tracking of mode shapes are presented here as a supplementary. Some samples of the monitored mode shapes of W1 with the proposed method before the final stage are presented. The mode shapes keep stable in the machining process because of the physical constraints.
Despite of the deficiency of global modal information and signal noise, the proposed method can help to reduce the average relative errors of mode shapes steadily as presented in Fig. 6.
![]()
The paper mainly focuses on the principles and framework of the updating approach. The validation experiments are only based on two typical kinds of workpiece to present the practicability and the performance of the proposed method. In further studies, the generality of the proposed method will be discussed with improved theoretical analysis and more sufficient experimental data on more complicated thin-walled structures like turbine blades and pocket structures. The generality of the proposed method can be extended by selecting proper mode shape functions \(W (x, y)\) and boundary conditions for various structures.
D. Modal damping update
As illustrated in the paper, the damping ratios are directly obtained by impact hammer modal analysis considering the significant disturbance of process damping and the high noise introduced by the machining process. As there is no prior information on the damping ratios given by the FEM, the varying damping ratios during the machining can only be approximated by the interpolation of the tested values. Consequently, the variance of the predicted results can be very large, and the final results of damping ratios are not reliable in practical application.
Nevertheless, we try to present the monitoring results of the damping ratios.
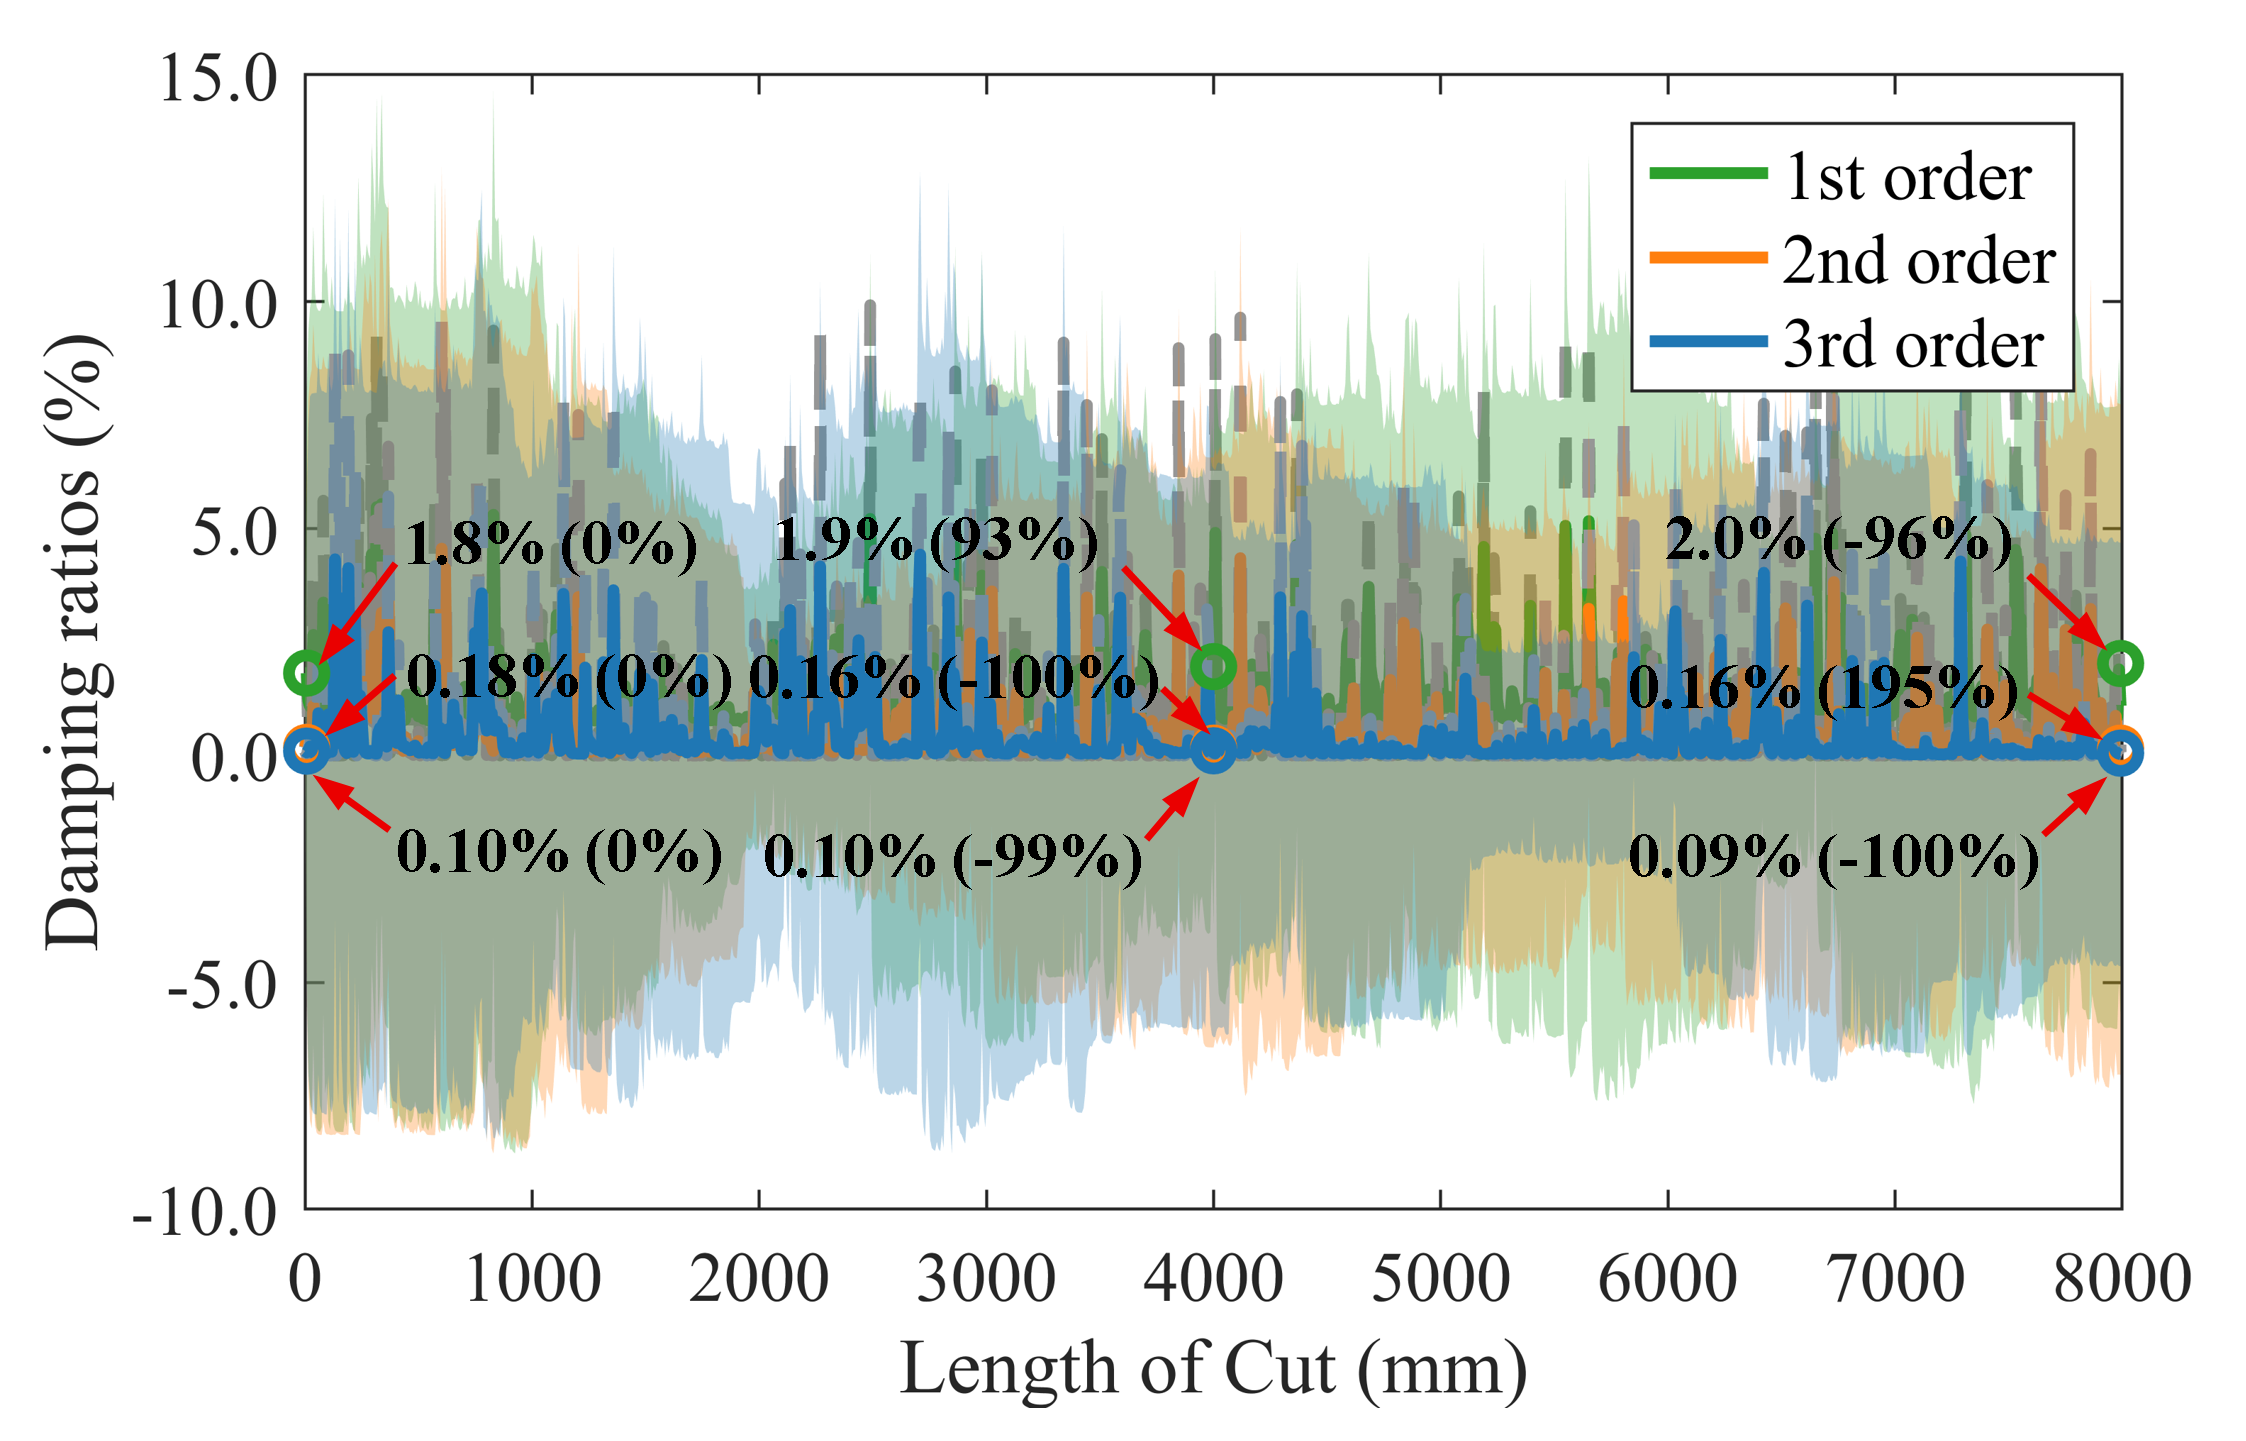
The true values of the damping ratios are measured by impact hammer modal test and indicated as circles on each line. The relative errors of the predicted results to the true values are presented in the brackets. The true values of the final state after machining process are 2.0 %, 0.16 %, and 0.09 % respectively, and the corresponding relative errors are -96 %,195 %, and -100 % of the first 3 modes. The relative errors are equal to zero at the beginning because the initialization is based on the values of the modal test. The results indicate a significant variance even with an artificial pre-processing of abnormal values, suggesting that the predicted value may not be reliable. Consequently, the update of damping ratios is not implemented in the paper. Improved modal parameters identification method for damping ratios under such noisy conditions can be studied in future research to enhance the accuracy and stability.
本博客所有文章除特别声明外,均采用 CC BY-SA 4.0 协议 ,转载请注明出处!